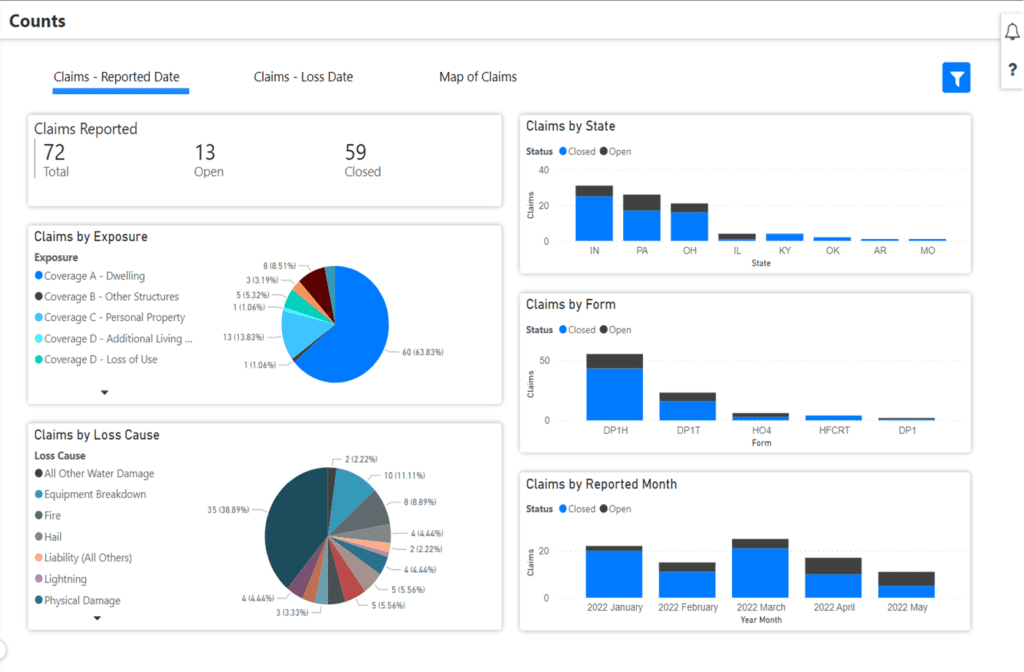
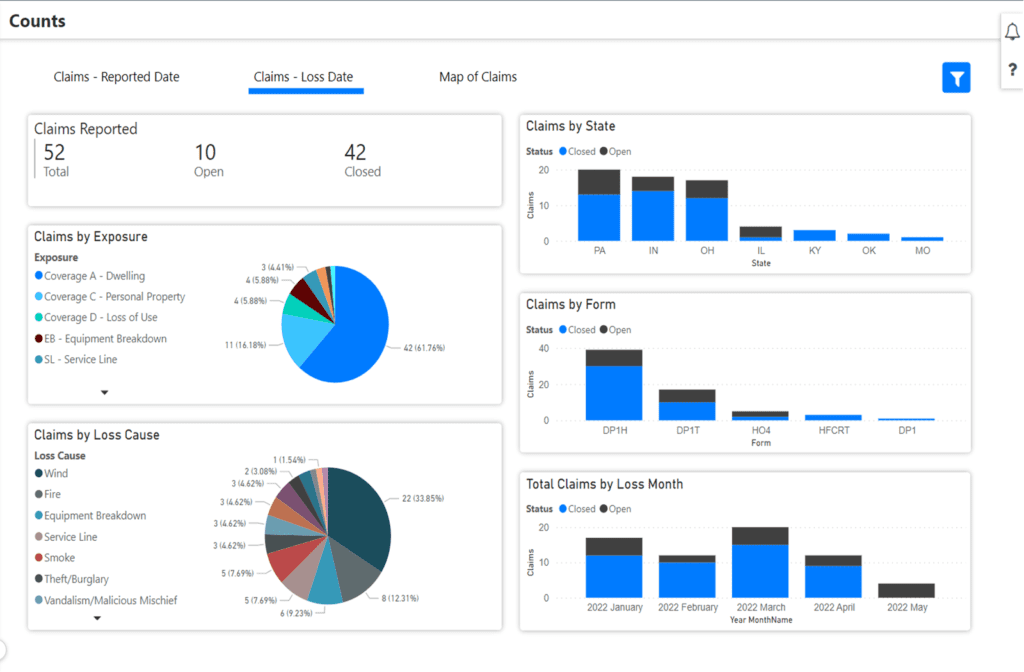
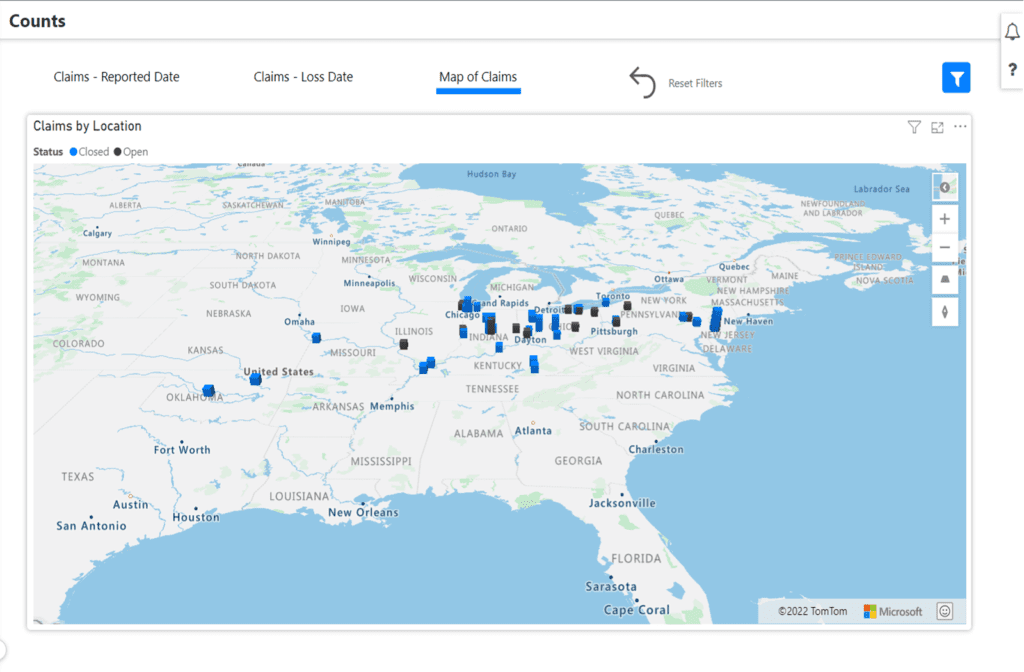
Understanding why there are past losses is the key to preventing future losses. By diving into claims data, insurance experts can narrow down the root of causes behind loss and exposure pertaining to products, date ranges, location and more. Visualizing these trends saves time when understanding the big picture behind losses.
Claims managers, underwriting managers, product managers and executives have interest in understanding the counts of claim exposures to understand what is driving the loss ratio. Claims analysis is essential to calculating what is driving the loss ratio.
WaterStreet Company can help insurers save immense time analyzing claims data with our Business Intelligence Suite, including:
- Analyze the count of claim exposures by reported date and loss date.
- Review what is driving the loss ratio by product.
- Save hours of manual review through automation and visualizations.
- Review granular loss causes and access descriptions in claims records for notes on damages.
Claims Count Analytics

“With WaterStreet’s Business Intelligence Suite, every user becomes an instant analyst, gaining efficiencies with automation in day-to-day reporting processes as well as improving overall decision-making with reliable data,” – Kelly King, CFO, WaterStreet Company.
What is the most efficient way to review causes of claims?
The cause of loss, when combined with loss ratio analysis and various policy and risk characteristics, is a necessary and powerful use of time in all aspects of insurance. Insurance experts should consider risk selection, peril characteristics with evolving trends and pricing risks while reviewing the causes of loss and exposure. The goal is to build an association between causes of loss with those characteristics and geographic location.

How can I get started reviewing claim exposures on specific products in my business?
Visual displays are key to understanding trends in claims counts. Selecting many of the core components behind loss along with policy characteristics helps experts view losses and exposures in relation to one another. This leads to identifying areas requiring greater scrutiny and research for shaping future products and rates.

Can I drill down into specific claims when comparing claims by exposures and losses?
Insurance experts can become granular when reviewing claims data through claims count analysis. For example, reviewing the difference between water loss claims and non-water loss claims can reveal geographic regions of common flooding, shaping policies and rates offered in these regions to help balance the loss ratio.
WaterStreet Company & Claims Count Analysis
WaterStreet Company aims to deliver best-in-class solutions for P&C insurers. This year, we’ve launched our Business Intelligence Suite to help insurers track vital key performance indicators specific to the insurance industry.
We provide advanced P&C Insurance Software designed to grow with your business, allowing integration with next-generation solutions.
Ready to Take Action?
Reach out to WaterStreet Company today to request a consultation and demo of our solutions.


